Just making Bash debug logs (traces) look cool.
This article introduces how to decorate Bash debug logs (traces) to make them more readable and colorful. Using this method, debug information becomes easier to see, making working with editors and logs more enjoyable.
Customizing PS4
To decorate Bash debug logs, customize the PS4 environment variable. Here’s an example of decorating PS4 colorfully:
red=$'\e[1;31m'
grn=$'\e[1;32m'
yel=$'\e[1;33m'
blu=$'\e[1;34m'
mag=$'\e[1;35m'
cyn=$'\e[1;36m'
end=$'\e[0m'
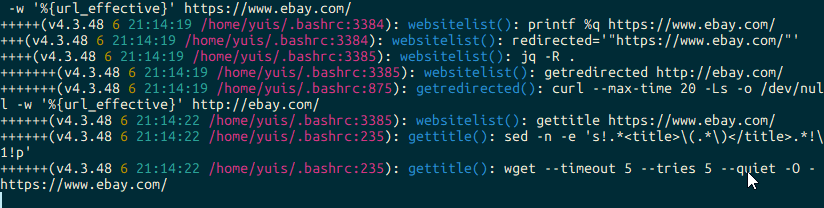
export PS4='+(v\V ${yel}\#${end} ${cyn}\t${end} ${mag}${BASH_SOURCE}:${LINENO}${end}): ${blu}${FUNCNAME:+$FUNCNAME()}${end}: 'This code customizes PS4 to color each part of the debug log and decorate function names, file names, line numbers, etc.
Toggle Debug
Additionally, you can add the sx function to easily enable or disable debugging. Here’s an example of the sx function:
sx() {
# Command to toggle "set -x/+x"
# Example: sx
if [[ ${sx_status} =~ enabled ]]; then
set +x
printf "\n\n${grn}Debug disabled.${end}\n\n"
sx_status=disabled
return 0
elif [[ ${sx_status} =~ disabled| ]]; then
set -x
printf "\n\n${red}Debug enabled.${end}\n\n"
sx_status=enabled
return 0
fi
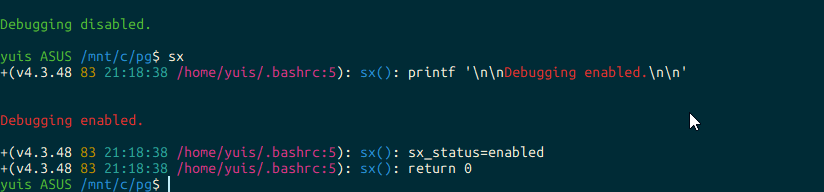
}Using this sx function, you can toggle debugging on or off and display the debug status colorfully.
By using these customizations, Bash debug logs become easier to read, and tracing might become more enjoyable.
That’s all.